Internal Data Reports
Student Achievement Data
Texas A&M International University (TAMIU) evaluates student achievement in relation to the University’s mission, considering course completion, State licensing examinations, graduation rates, retention rates, and job placement information as appropriate. These data findings are reported annually to the Texas Legislative Budget Board and the Texas Higher Education Coordinating Board. In addition, The Texas A&M University System maintains a website to hold Member institutions accountable for measuring results.
Degrees Awarded
List of degrees awarded. Click below to access.
Degrees Awarded 2016 to Fall 2025(PDF)Classification of Instructional Program (CIP) codes are used to identify approved degree programs. Click below to access Texas A&M International University’s Degree Inventory.
Degree Inventory by CIP Codes(PDF)Semester Credit Hours
Fall 2024 to Fall 2025(PDF)Criteria, Thresholds and Outcomes
The mission of TAMIU is to nurture its students’ academic and social development to be responsible and productive members of our global society. TAMIU contributes to this mission through the strategic plan goals(PDF), specifically through Strategic Plan Goal 2: Empowered Student Success and Wellness and Strategic Goal 4: Transformative International Experience.
In its Student Achievement Core Requirement 8.1(PDF) (CR 8.1), the Southern Association of College and Schools Commission on Colleges (SACSCOC) requires institutions identify and publish Student Achievement criteria, goals, thresholds of acceptability and outcomes.
Student Achievement Criteria identified by TAMIU are first-year retention rate, undergraduate graduation rates, completions by Economically Disadvantaged Students, total degrees conferred, and first-attempt licensure passing rate. These criteria are measured by IPEDS Fall-to-Fall Cohort Retention, 4-year, 6-year, and 8-year Undergraduate Graduation Rate, 4-year Transfer Graduation Rate, and Licensure Passing Rates for Teacher Certification and NCLEX. Thresholds and aspirational goals for these measures are below.
Information regarding institutional performance on these measures is as follows:
Student Achievement Reports
Comparator Peers
Five similar universities are provided to the TAMU system by the Texas Higher Coordinating Board.
- Lamar University
- Prairie View A&M University
- Tarleton University
- Stephen F. Austin State University
- West Texas A&M University
Summary Table of Student Achievement Measures and Current Status (Fall 2025)
| Measure | Threshold | Threshold of Acceptability Status | Goal | Goal Status |
|---|---|---|---|---|
| First-Year Persistence Rate | 60% | Met | 76% | Not Met |
| 4-Year Graduation Rate | 23% | Met | 29% | Not Met |
| 6-Year Graduation Rate | 39% | Met | 50% | Not Met |
| 8-Year Graduation Rate – Student Completion Indicator for SACSCOC | 42% | Met | 45% | Met |
| 4-Year Non-First Time Entering (Transfer) Graduation Rate | 31% | Met | 59% | Not Met |
| Percent Completions by Economically Disadvantaged Students | 41% | Met | 48% | Met |
| Total Degrees Conferred | 1534 | Met | 2150 | Not Met |
| State Licensure Pass Rates - Nursing (NCLEX) | 80% | Met | 98.03% | Met |
| State Licensure Pass Rates - Teacher Certification | 80% | Met | 85% | Met |
First year retention rate - fall 2025
Definition: The percentage of first-time, full-time students seeking bachelor’s degrees who returned to Texas A&M International University for their second year (fall-to-fall retention).
Source: IPEDS, CBM0E1, THECB, TAMIU Institutional Research Office
Threshold of Acceptability: The average rate of the prior cohort year for the five similar universities. Five similar universities are provided to the TAMU system by the Texas Higher Coordinating Board.
Goal: Stretch Goal set by Institution and reported by A&M System
Status for Current Year: Above the threshold of acceptability but below the goal.
Figure 1
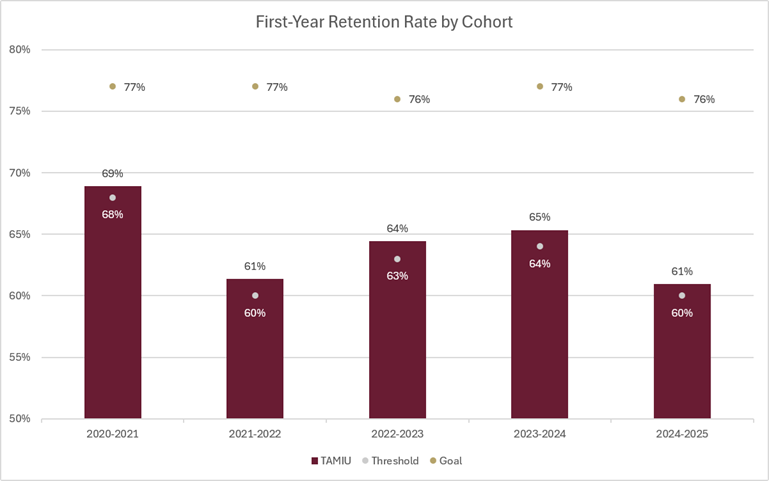
| First-Year Retention Rate by Cohort | |||
| Cohort | Threshold | Goal | TAMIU |
| 2020-2021 | 68% | 77% | 69% |
| 2021-2022 | 60% | 77% | 61% |
| 2022-2023 | 63% | 76% | 64% |
| 2023-2024 | 64% | 77% | 65% |
| 2024-2025 | 60% | 76% | 61% |
Figure 2
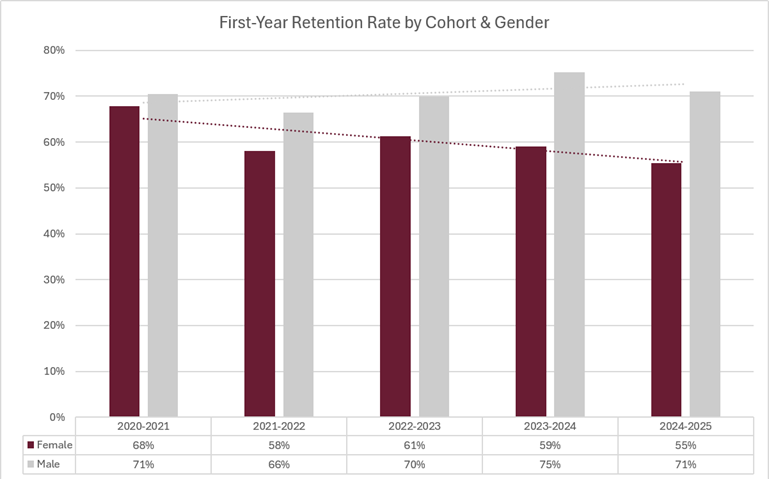
| First-Year Retention Rate by Cohort & Gender | |||||
| Gender | 2020-2021 | 2021-2022 | 2022-2023 | 2023-2024 | 2024-2025 |
| Female | 68% | 58% | 61% | 59% | 55% |
| Male | 71% | 66% | 70% | 75% | 71% |
Figure 3
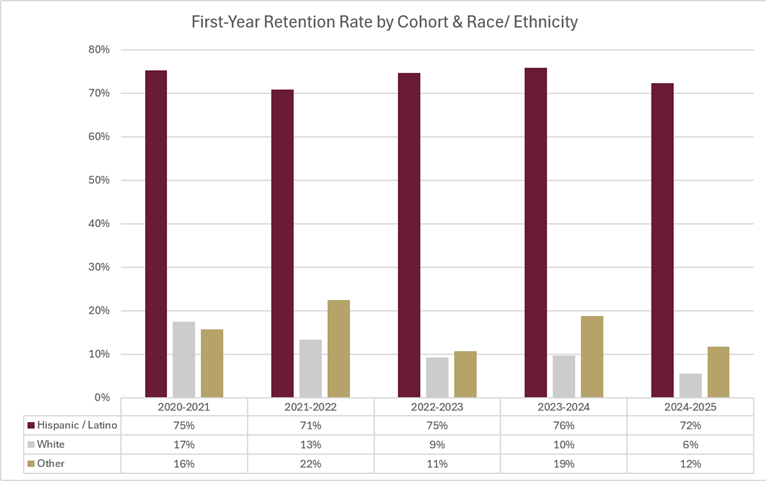
| First-Year Retention Rate by Cohort & Race/ Ethnicity | |||||
| Race/Ethnicity | 2020-2021 | 2021-2022 | 2022-2023 | 2023-2024 | 2024-2025 |
| Hispanic/Latino | 75% | 71% | 75% | 76% | 72% |
| White | 17% | 13% | 9% | 10% | 6% |
| Other | 16% | 22% | 11% | 19% | 12% |
Figure 4
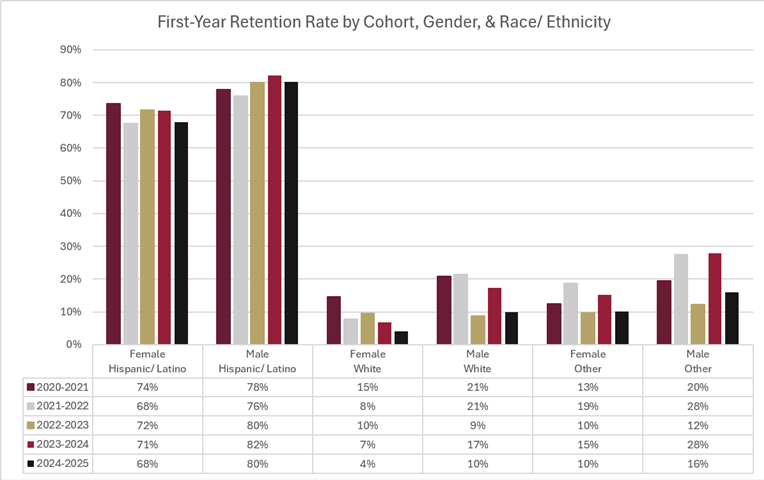
| First-Year Retention Rate by Cohort, Gender, & Race/ Ethnicity | ||||||
| Cohort | Female Hispanic/ Latino | Male Hispanic/ Latino | Female White | Male White | Female Other | Male Other |
| 2020-2021 | 74% | 78% | 15% | 21% | 13% | 20% |
| 2021-2022 | 68% | 76% | 8% | 21% | 19% | 28% |
| 2022-2023 | 72% | 80% | 10% | 9% | 10% | 12% |
| 2023-2024 | 71% | 82% | 7% | 17% | 15% | 28% |
| 2024-2025 | 68% | 80% | 4% | 10% | 10% | 16% |
4-year graduation rate - fall 2025
Definition: The percentage of first-time, full-time students seeking bachelor’s degrees who graduated from TAMIU within 4 years.
Source: IPEDS, CBM0E1, THECB, and TAMIU Institutional Research Office
Threshold of Acceptability: The average rate of the prior cohort year for the five similar universities. Five similar universities are provided to the TAMU system by the Texas Higher Coordinating Board.
Goal: Stretch Goal set by Institution and reported by A&M System
Status for Current Year: Above the threshold of acceptability but below the goal.
Figure 5
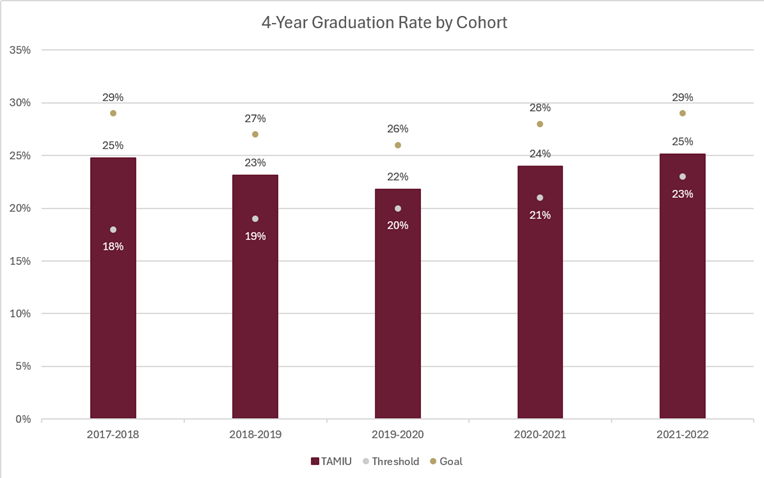
| 4-Year Graduation Rate by Cohort | |||
| Cohort | Threshold | Goal | TAMIU |
| 2017-2018 | 18% | 29% | 25% |
| 2018-2019 | 19% | 27% | 23% |
| 2019-2020 | 20% | 26% | 22% |
| 2020-2021 | 21% | 28% | 24% |
| 2021-2022 | 23% | 29% | 25% |
Figure 6
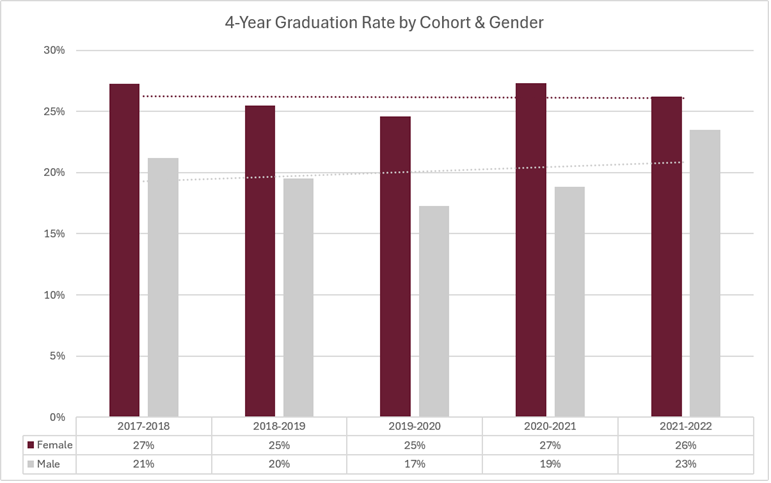
| 4-Year Graduation Rate by Cohort & Gender | |||||
| Gender | 2017-2018 | 2018-2019 | 2019-2020 | 2020-2021 | 2021-2022 |
| Female | 27% | 25% | 25% | 27% | 26% |
| Male | 21% | 20% | 17% | 19% | 23% |
Figure 7
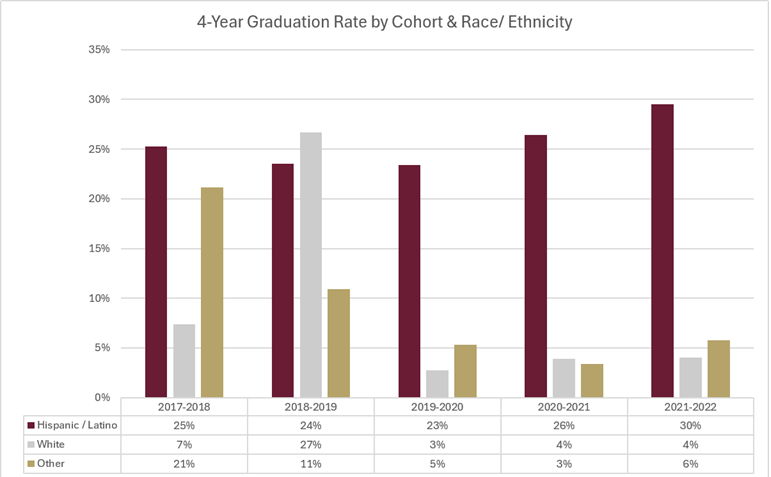
| 4-Year Graduation Rate by Cohort & Race/ Ethnicity | |||||
| Race/Ethnicity | 2017-2018 | 2018-2019 | 2019-2020 | 2020-2021 | 2021-2022 |
| Hispanic/Latino | 25% | 24% | 23% | 26% | 30% |
| White | 7% | 27% | 3% | 4% | 4% |
| Other | 21% | 11% | 5% | 3% | 6% |
Figure 8
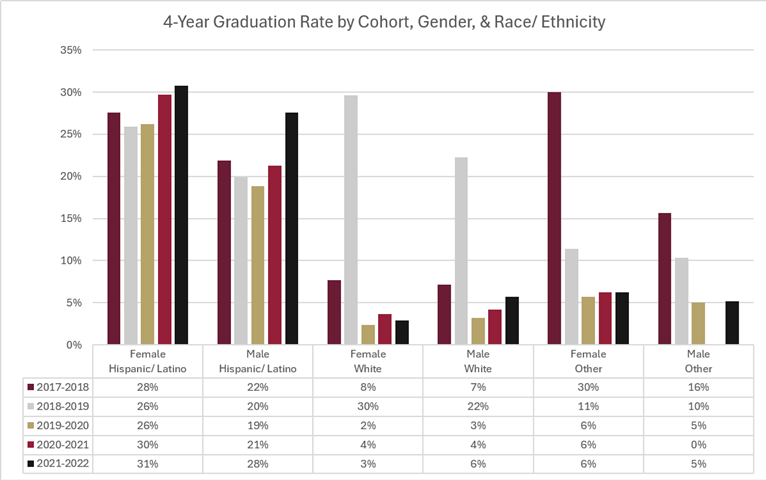
| 4-Year Graduation Rate by Cohort, Gender, & Race/ Ethnicity | ||||||
| Cohort | Female Hispanic/ Latino | Male Hispanic/ Latino | Female White | Male White | Female Other | Male Other |
| 2017-2018 | 28% | 22% | 8% | 7% | 30% | 16% |
| 2018-2019 | 26% | 20% | 30% | 22% | 11% | 10% |
| 2019-2020 | 26% | 19% | 2% | 3% | 6% | 5% |
| 2020-2021 | 30% | 21% | 4% | 4% | 6% | 0% |
| 2021-2022 | 31% | 28% | 3% | 6% | 6% | 5% |
6-year graduation rate - fall 2025
Definition: The percentage of first-time, full-time students seeking bachelor’s degrees who graduated from TAMIU within 6 years.
Source: IPEDS, CBM0E1, THECB, and TAMIU Institutional Research Office
Threshold of Acceptability: The average rate of the prior cohort year for the five similar universities. Five similar universities are provided to the TAMU system by the Texas Higher Coordinating Board.
Goal: Stretch Goal set by Institution and reported by A&M System
Status for Current Year: Above the threshold of acceptability but below goal.
Figure 9
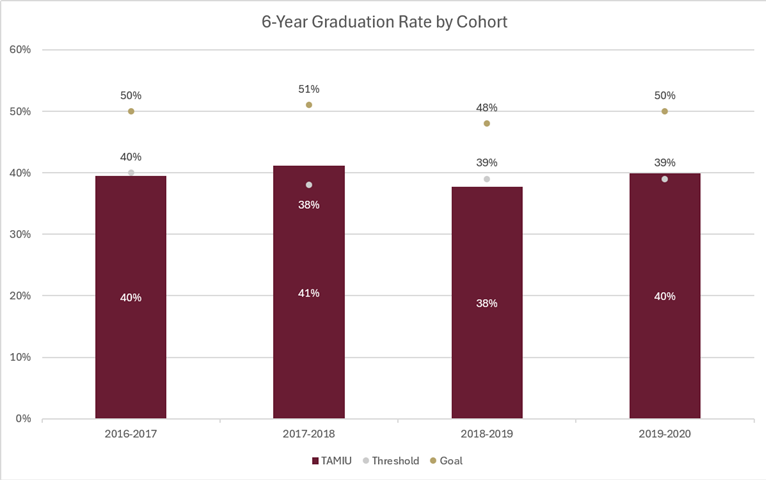
| 6-Year Graduation Rate by Cohort | |||
| Cohort | Threshold | Goal | TAMIU |
| 2016-2017 | 40% | 50% | 40% |
| 2017-2018 | 38% | 51% | 41% |
| 2018-2019 | 39% | 48% | 38% |
| 2019-2020 | 39% | 50% | 40% |
Figure 10
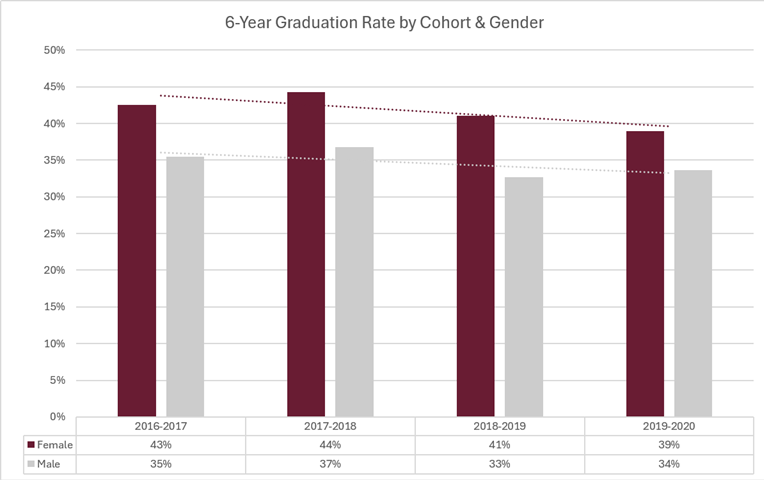
| 6-Year Graduation Rate by Cohort & Gender | ||||
| Gender | 2016-2017 | 2017-2018 | 2018-2019 | 2019-2020 |
| Female | 43% | 44% | 41% | 39% |
| Male | 35% | 37% | 33% | 34% |
Figure 11
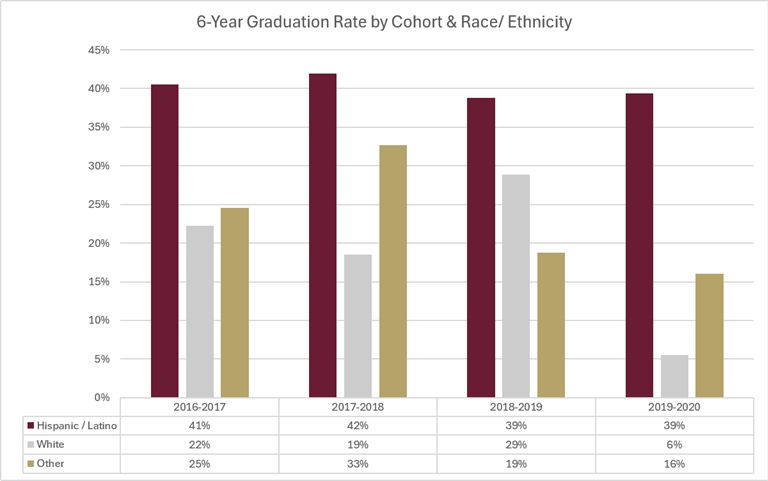
| 6-Year Graduation Rate by Cohort & Race/ Ethnicity | ||||
| Race/Ethnicity | 2016-2017 | 2017-2018 | 2018-2019 | 2019-2020 |
| Hispanic/Latino | 41% | 42% | 39% | 39% |
| White | 22% | 19% | 39% | 6% |
| Other | 25% | 33% | 19% | 16% |
Figure 12
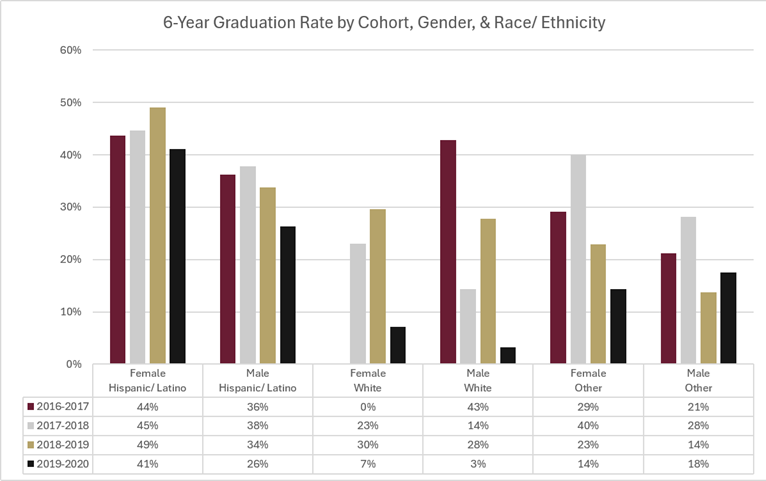
| 6-Year Graduation Rate by Cohort, Gender, & Race/ Ethnicity | ||||||
| Cohort | Female Hispanic/ Latino | Male Hispanic/ Latino | Female White | Male White | Female Other | Male Other |
| 2016-2017 | 44% | 36% | 0% | 43% | 29% | 21% |
| 2017-2018 | 45% | 38% | 23% | 14% | 40% | 28% |
| 2018-2019 | 49% | 34% | 30% | 28% | 23% | 14% |
| 2019-2020 | 41% | 26% | 7% | 3% | 14% | 18% |
8-year graduation rate - fall 2025
Definition: The percentage of first-time, full-time students seeking bachelor’s degrees who graduated from TAMIU within 8 years.
Source: IPEDS, CBM0E1, THECB, and TAMIU Institutional Research Office
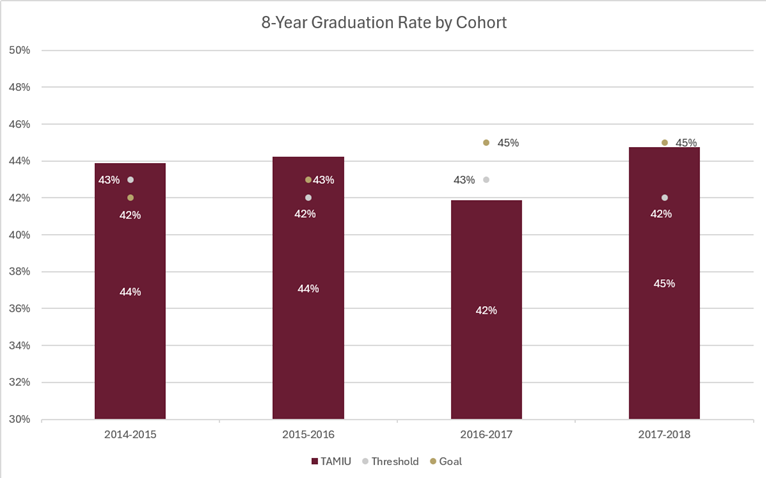
Threshold of Acceptability: The average rate of the prior cohort year for the five similar universities. Five similar universities are provided to the TAMU system by the Texas Higher Coordinating Board.
Goal: Stretch Goal set by Institution and reported by A&M System
Status for Current Year: Above the threshold of acceptability and met goal.
Figure 13
| 8-Year Graduation Rate by Cohort | |||
| Cohort | Threshold | Goal | TAMIU |
| 2014-2015 | 43% | 42% | 44% |
| 2015-2016 | 42% | 43% | 44% |
| 2016-2017 | 43% | 45% | 42% |
| 2017-2018 | 42% | 45% | 45% |
Figure 14
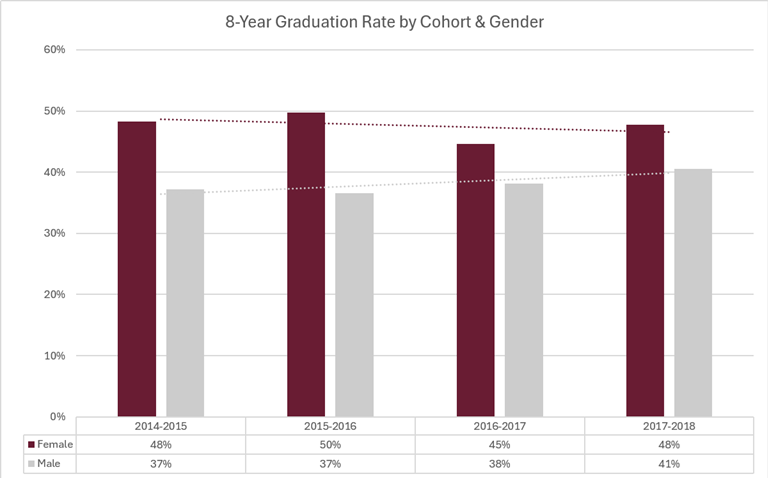
| 8-Year Graduation Rate by Cohort & Gender | ||||
| Gender | 2014-2015 | 2015-2016 | 2016-2017 | 2017-2018 |
| Female | 48% | 50% | 45% | 48% |
| Male | 37% | 37% | 38% | 41% |
Figure 15
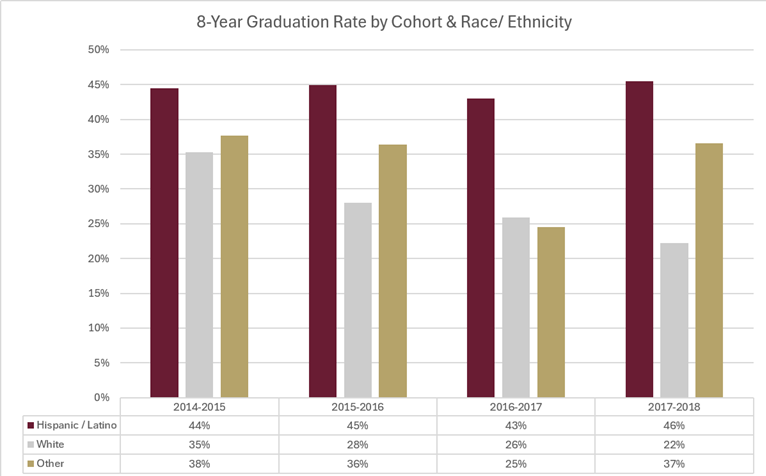
| 8-Year Graduation Rate by Cohort & Race/ Ethnicity | ||||
| Race/Ethnicity | 2014-2015 | 2015-2016 | 2016-2017 | 2017-2018 |
| Hispanic/Latino | 44% | 45% | 43% | 46% |
| White | 35% | 28% | 26% | 22% |
| Other | 38% | 36% | 25% | 37% |
Figure 16
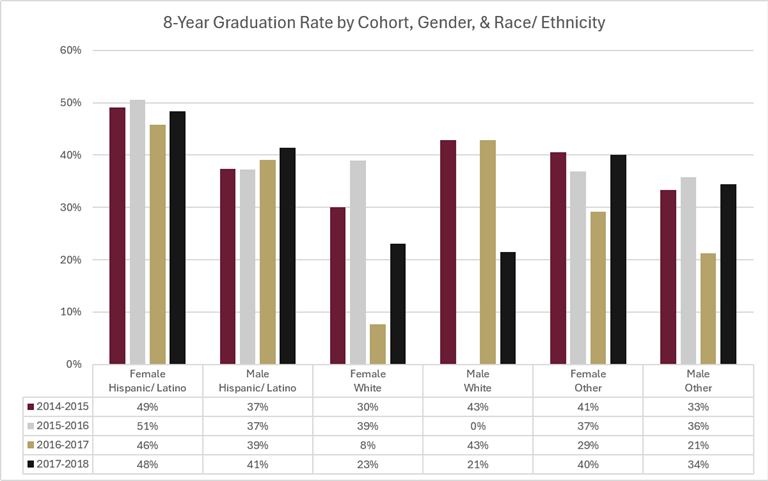
| 8-Year Graduation Rate by Cohort, Gender, & Race/ Ethnicity | ||||||
| Cohort | Female Hispanic/ Latino | Male Hispanic/ Latino | Female White | Male White | Female Other | Male Other |
| 2014-2015 | 49% | 37% | 30% | 43% | 41% | 33% |
| 2015-2016 | 51% | 37% | 39% | 0% | 37% | 36% |
| 2016-2017 | 46% | 39% | 8% | 43% | 29% | 21% |
| 2017-2018 | 48% | 41% | 23% | 21% | 40% | 34% |
4-year Non-First Time Entering (Transfer) graduation rate - fall 2025
Definition: The percentage of full-time non-first-time entering students by cohort year who pursued bachelor’s degrees and who graduated from Texas A&M International within 4 years.
Source: IPEDS, CBM0E1, THECB, and TAMIU Institutional Research Office
Threshold of Acceptability: The average rate of the prior cohort year for the five similar universities. Five similar universities are provided to the TAMU system by the Texas Higher Coordinating Board.
Goal: Stretch Goal set by Institution and reported by A&M System
Status for Current Year: Above the threshold of acceptability but below the goal.
Figure 17
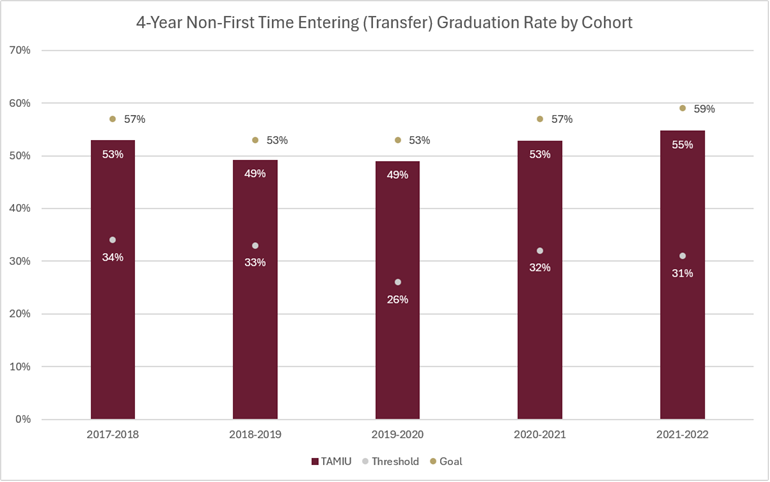
| 4-Year Non-First Time Entering (Transfer) Graduation Rate by Cohort | |||
| Cohort | Threshold | Goal | TAMIU |
| 2017-2018 | 34% | 57% | 53% |
| 2018-2019 | 33% | 53% | 49% |
| 2019-2020 | 26% | 53% | 49% |
| 2020-2021 | 32% | 57% | 53% |
| 2021-2022 | 31% | 59% | 55% |
Figure 18
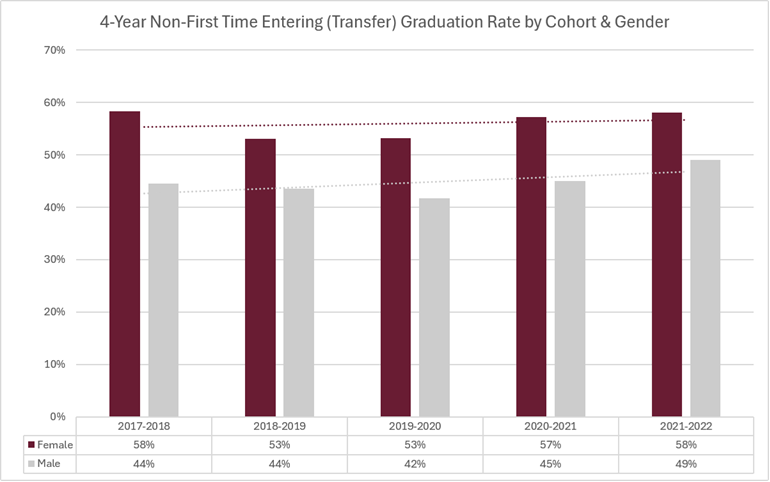
| 4-Year Non-First Time Entering (Transfer) Graduation Rate by Cohort & Gender | |||||
| Gender | 2017-2018 | 2018-2019 | 2019-2020 | 2020-2021 | 2021-2022 |
| Female | 58% | 53% | 53% | 57% | 58% |
| Male | 44% | 44% | 42% | 45% | 49% |
Figure 19
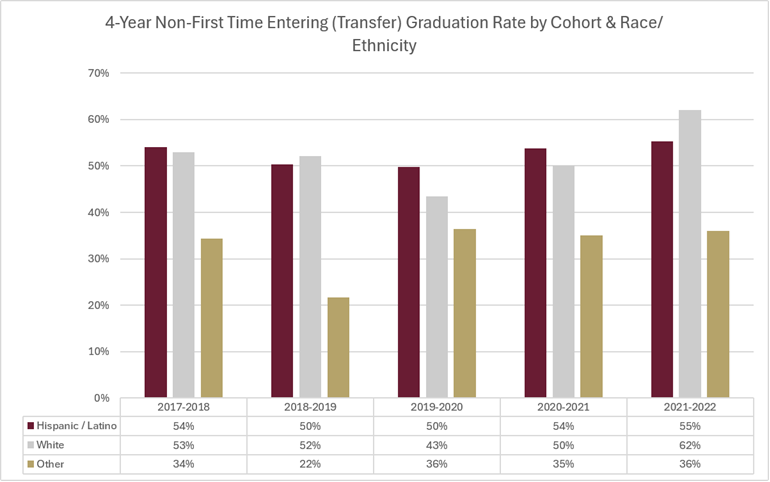
| 4-Year Non-First Time Entering (Transfer) Graduation Rate by Cohort & Race/ Ethnicity | |||||
| Race/Ethnicity | 2017-2018 | 2018-2019 | 2019-2020 | 2020-2021 | 2021-2022 |
| Hispanic/Latino | 54% | 50% | 50% | 54% | 55% |
| White | 53% | 52% | 43% | 50% | 62% |
| Other | 34% | 22% | 36% | 35% | 36% |
Figure 20
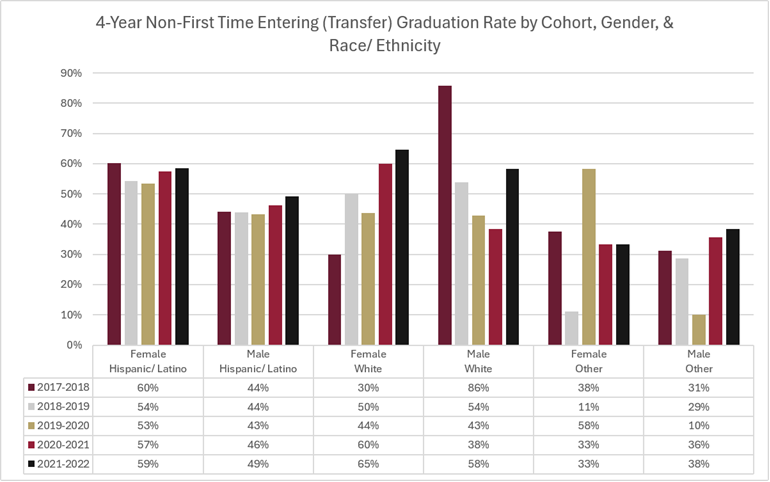
| 4-Year Non-First Time Entering (Transfer) Graduation Rate by Cohort, Gender, & Race/ Ethnicity | ||||||
| Cohort | Female Hispanic/ Latino | Male Hispanic/ Latino | Female White | Male White | Female Other | Male Other |
| 2017-2018 | 60% | 44% | 30% | 86% | 38% | 31% |
| 2018-2019 | 54% | 44% | 50% | 54% | 11% | 29% |
| 2019-2020 | 53% | 43% | 44% | 43% | 58% | 10% |
| 2020-2021 | 57% | 46% | 60% | 58% | 33% | 36% |
| 2021-2022 | 59% | 49% | 65% | 58% | 33% | 38% |
Completions by economically disadvantaged students - fall 2025
Definition: The number of bachelor’s degrees awarded to economically disadvantaged students—those receiving Pell Grants at any time.
Source: IPEDS, CBM0E1, THECB, and TAMIU Institutional Research Office
Threshold of Acceptability: The average rate of the prior cohort year for the five similar universities. Five similar universities are provided to the TAMU system by the Texas Higher Coordinating Board.
Goal: Stretch Goal set by Institution and reported by A&M System
Status for Current Year: Above the threshold of acceptability and goal.
Figure 21
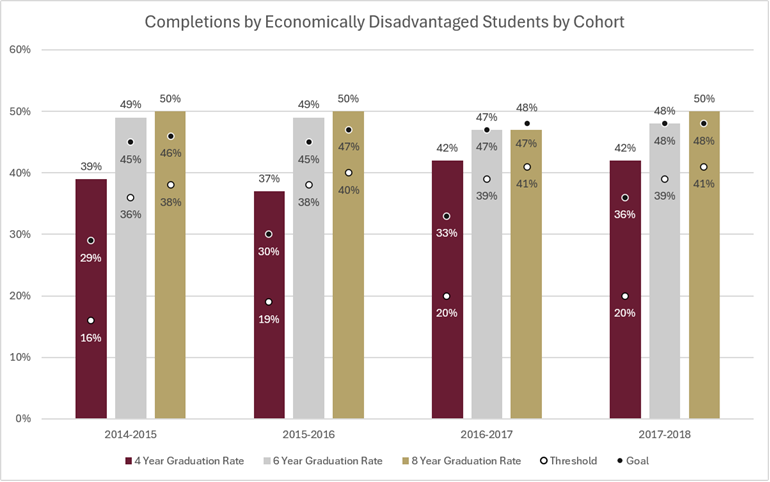
| Completions by Economically Disadvantaged Students by Cohort | |||||||||
| Cohort | 4-Year Threshold | 4-Year Goal | 4-Year Grad Rate | 6-Year Threshold | 6-Year Goal | 6-Year Grad Rate | 8-Year Threshold | 8-Year Goal | 8-Year Grad Rate |
| 2014-2015 | 16% | 29% | 39% | 36% | 45% | 49% | 38% | 46% | 50% |
| 2015-2016 | 19% | 30% | 37% | 38% | 45% | 49% | 40% | 47% | 50% |
| 2016-2017 | 20% | 33% | 42% | 39% | 47% | 47% | 41% | 48% | 47% |
| 2017-2018 | 20% | 36% | 42% | 39% | 48% | 48% | 41% | 48% | 50% |
total degrees conferred - fall 2025
Definition: The number of bachelor’s and graduate degrees awarded.
Source: IPEDS, CBM0E1, THECB, and TAMIU Institutional Research Office
Threshold of Acceptability: The average rate of the prior cohort year for the five similar universities. Five similar universities are provided to the TAMU system by the Texas Higher Coordinating Board.
Goal: Stretch Goal set by Institution and reported by A&M System
Status for Current Year: Above the threshold of acceptability but below the goal.
Figure 22
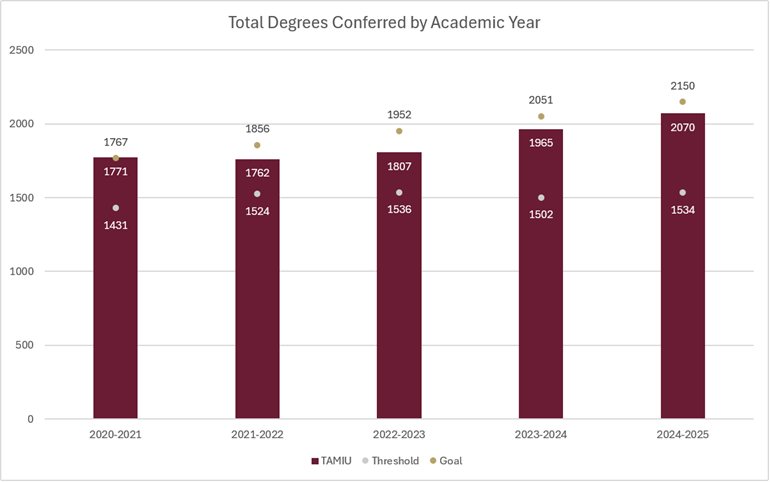
| Total Degrees Conferred by Academic Year | |||
| Cohort | Threshold | Goal | TAMIU |
| 2020-2021 | 1431 | 1767 | 1771 |
| 2021-2022 | 1524 | 1856 | 1762 |
| 2022-2023 | 1536 | 1952 | 1807 |
| 2023-2024 | 1502 | 2051 | 1965 |
| 2024-2025 | 1534 | 2150 | 2070 |
Figure 23
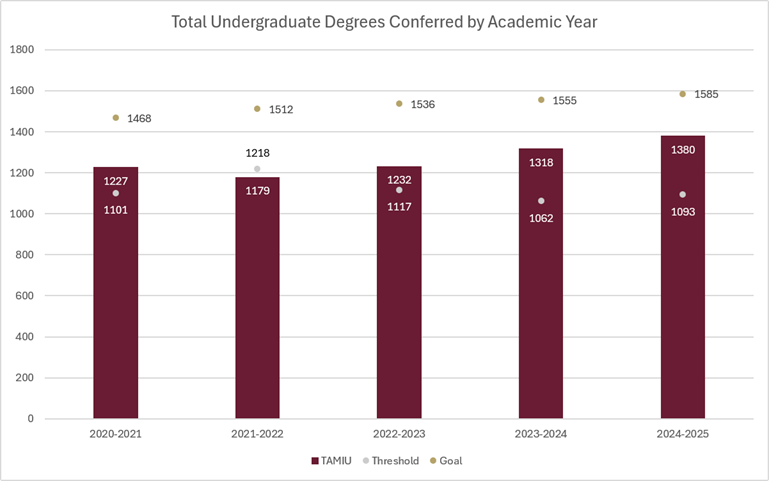
| Total Undergraduate Degrees Conferred by Academic Year | |||
| Cohort | Threshold | Goal | TAMIU |
| 2020-2021 | 1101 | 1468 | 1227 |
| 2021-2022 | 1218 | 1512 | 1179 |
| 2022-2023 | 1117 | 1536 | 1232 |
| 2023-2024 | 1062 | 1555 | 1318 |
| 2024-2025 | 1093 | 1585 | 1380 |
Figure 24
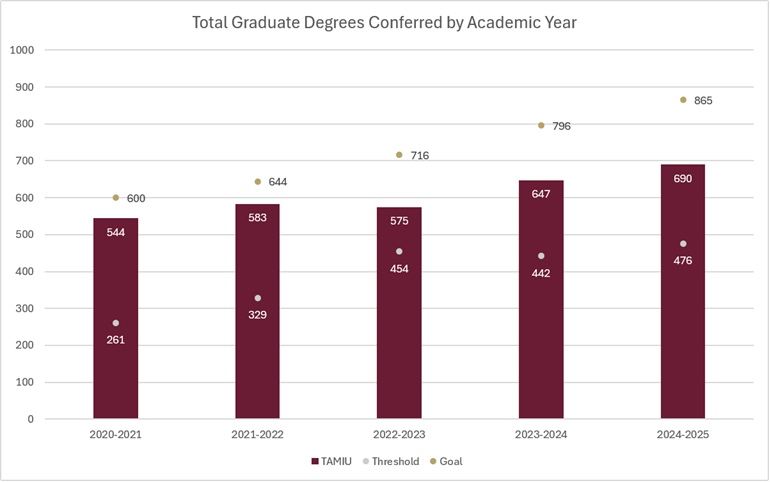
| Total Graduate Degrees Conferred by Academic Year | |||
| Cohort | Threshold | Goal | TAMIU |
| 2020-2021 | 261 | 600 | 544 |
| 2021-2022 | 329 | 644 | 583 |
| 2022-2023 | 454 | 716 | 575 |
| 2023-2024 | 442 | 796 | 647 |
| 2024-2025 | 476 | 865 | 690 |
Figure 25
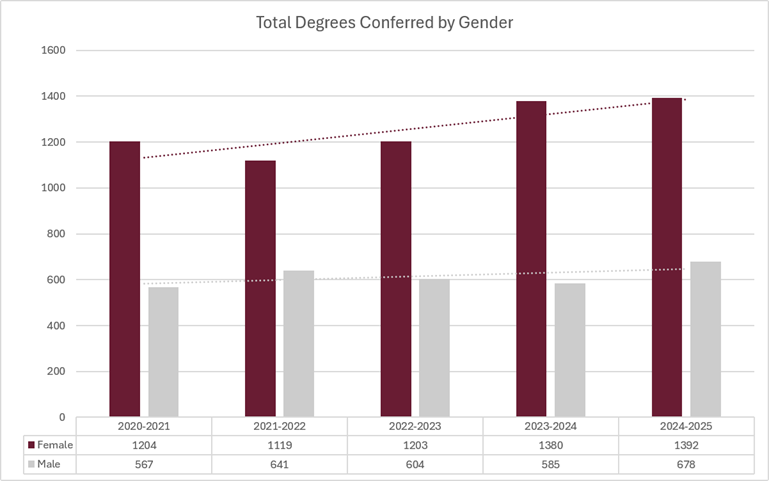
| Total Degrees Conferred by Gender | |||||
| Gender | 2020-2021 | 2021-2022 | 2022-2023 | 2023-2024 | 2024-2025 |
| Female | 1204 | 1119 | 1203 | 1380 | 1392 |
| Male | 567 | 641 | 604 | 585 | 678 |
Figure 26
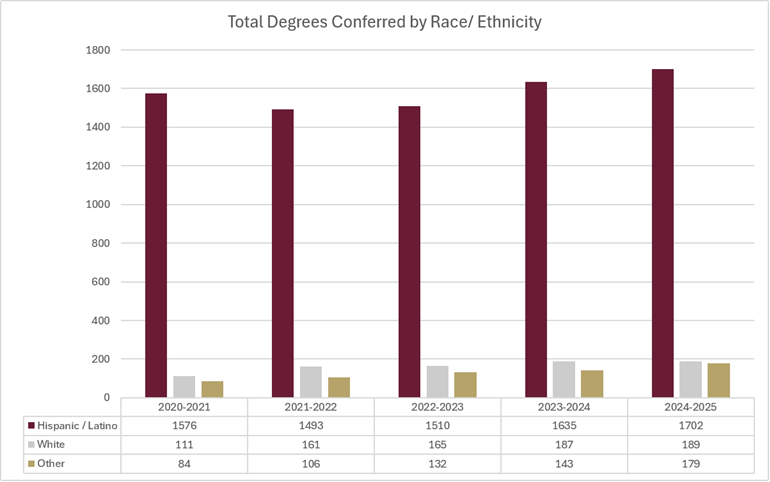
| Total Degrees Conferred by Race/ Ethnicity | |||||
| Race/Ethnicity | 2020-2021 | 2021-2022 | 2022-2023 | 2023-2024 | 2024-2025 |
| Hispanic/Latino | 1576 | 1493 | 1510 | 1635 | 1702 |
| White | 111 | 161 | 165 | 187 | 189 |
| Other | 84 | 106 | 132 | 143 | 179 |
Figure 27
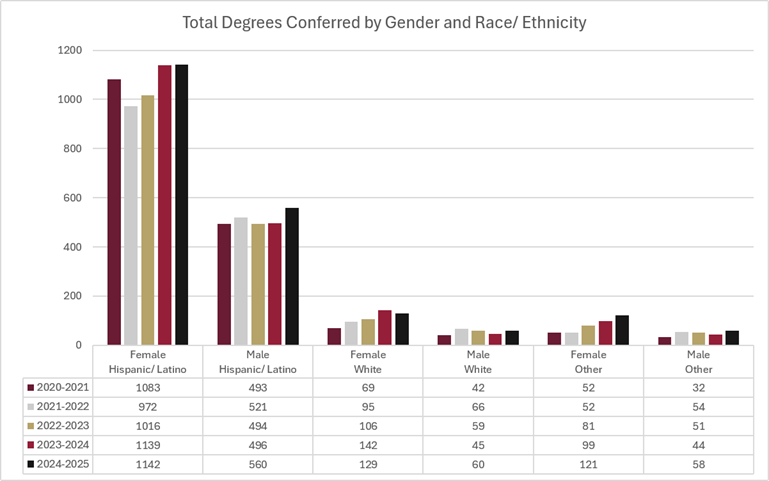
| Total Degrees Conferred by Gender & Race/ Ethnicity | ||||||
| Cohort | Female Hispanic/ Latino | Male Hispanic/ Latino | Female White | Male White | Female Other | Male Other |
| 2020-2021 | 1083 | 493 | 69 | 42 | 52 | 32 |
| 2021-2022 | 972 | 521 | 95 | 66 | 52 | 54 |
| 2022-2023 | 1016 | 494 | 106 | 59 | 81 | 51 |
| 2023-2024 | 1139 | 496 | 142 | 45 | 99 | 44 |
| 2024-2025 | 1142 | 560 | 129 | 60 | 121 | 58 |
state licensure pass rates - nursing (NCLEX) - fall 2025
Definition: The percentage of students who passed the National Council Licensure Examination–RN (Registered Nurse).
Source: Texas Board of Nursing
Threshold of Acceptability: Determined by the Accreditation Commission for Education in Nursing (ACEN)
Goal: A Target of one percent growth each year. The goal will not be decreased if numbers fall below the previous year’s numbers but will be maintained.
Status for Current Year: Above the threshold of acceptability and goal.
Figure 28
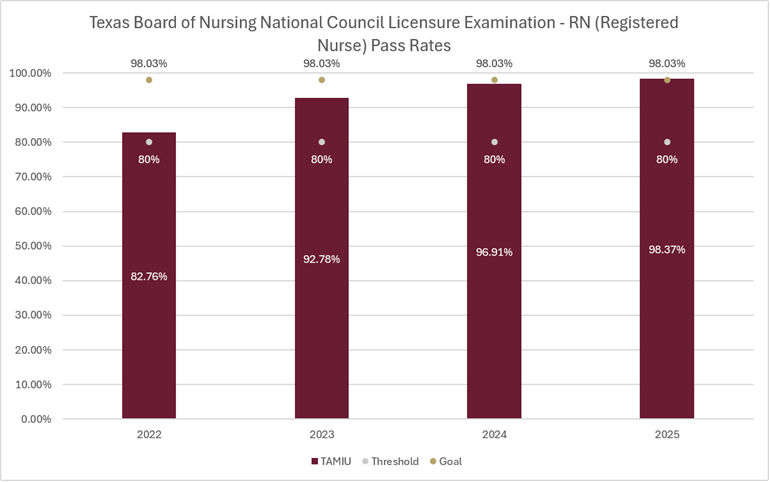
| Texas Board of Nursing National Council Licensure Examination - RN (Registered Nurse) Pass Rates | |||
| Year | Threshold | Goal | TAMIU |
| 2022 | 80% | 98.03% | 82.76% |
| 2023 | 80% | 98.03% | 92.78% |
| 2024 | 80% | 98.03% | 96.91% |
| 2025 | 80% | 98.03% | 98.37% |
state licensure pass rates - teacher standard certificate - fall 2025
Definition: The percentage of teacher candidates who finish a traditional program and obtain a standard teaching certificate within 1 year of graduating with a bachelor’s degree.
Source: Texas Education Agency (TEA)
Threshold of Acceptability: Determined by the State Board for Educator Certification (SBEC) and TEA
Goal: Determined by SBEC, TEA, and by Institution
Status for Current Year: Above the threshold of acceptability and goal.
Figure 29
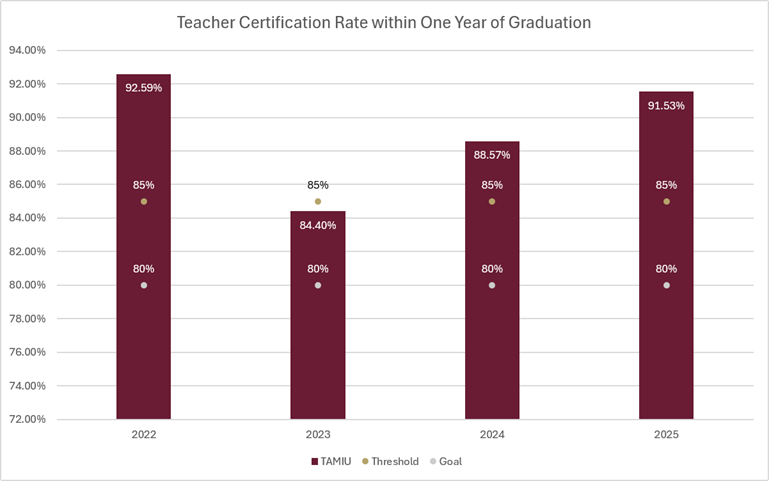
| Teacher Certification Rate within One Year of Graduation | |||
| Year | Threshold | Goal | TAMIU |
| 2022 | 80% | 85% | 92.59% |
| 2023 | 80% | 85% | 84.40% |
| 2024 | 80% | 85% | 88.57% |
| 2025 | 80% | 85% | 91.53% |
Fall 2025
Enrollment Breakdown(PDF)For Historical Information, please contact the Institutional Research Office at ir@tamiu.edu.
Contact
Office of Institutional Assessment, Research, and Planning
5201 University Boulevard, Sue and Radcliffe Killam Library 434, Laredo, TX 78041-1900
Phone: 956.326.2334
We are committed to ensuring accessibility for all visitors to our website. If you encounter any difficulties accessing our PDF documents or need materials in an alternative format, please contact Connie Lara at connielara@tamiu.edu. We will be happy to assist.