Educational Videos and Animations

This video is a planetarium show that highlights the different weather systems present on Earth. Developed with support from NASA's Education and Outreach program.
This is a NASA Approved Education Resource
640 X 643, 10mn 24s, stereo sound
Download Audio Version (47.3 Mb)
Download Closed Captioned Version (45.3 Mb)
The Animations below were funded by NSF Research Coordination Network - CE3SAR

Shows decade-by-decade changes in South Texas county population.
1280 X 720, 7.1Mb, 2mn 4s, no sound

Expansion of Texas urban area and petroleum fields is illustrated on an annual basis.
1080 X 720, 4.1 Mb, 2mn 0s, no sound

Historic (1984-2012) and future (2020-2070) total South Texas water demand (county) is illustrated.
1280 X 720, 2.6 Mb, 2mn 0s, no sound

Future (2020-2070) South Texas municipal water demand is depicted on a county basis.
1240 X 720, 2.6 Mb, 2mn 0s, no sound

Future (2020-2070) South Texas water demand is normalized on a per person basis in each county.
1240 X 720, 2.52 Mb, 2mn 0s, no sound
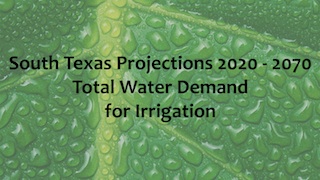
Future (2020-2070) South Texas water demand for irrigation in each county is shown.
1240 X 720, 2.44 Mb, 2mn 0s, no sound
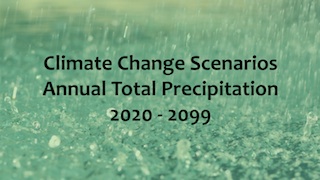
Business as usual climate change scenario illustrates possible changes in annual precipitation in Texas during the 21st century
1240 X 720, 3.3 Mb, 1mn 48s, no sound
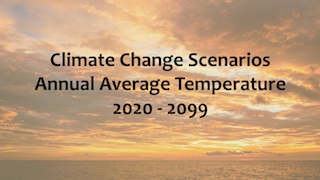
Business as usual climate change scenario shows the significant changes in annual average temperature in Texas during the 21st century.
1240 X 720, 3.1 Mb, 1mn 48s, no sound

SLOSH model results for Cameron County, Texas (Brownsville) showing inundation from storm surge associated with a category 1 to 5 hurricane.
1920 X 1080, 4.75 Mb, 1mn 6s, no sound
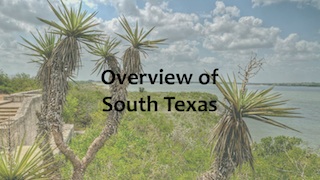
Geographic overview of South Texas that takes a tour of its major geographic features.
1280 X 720, 30.1 Mb, 5mn 0s, no sound